Australia’s estimated resident population at September 30, 2016 was just over 24.22 million, an increase of 1.4% over the previous year.  The growth of Australia’s population has two components: natural increase (the number of births minus the number of deaths) and net overseas migration. The growth rate was 5.1% which was higher than the natural increase recorded for the previous year. All states and territories recorded positive population growth in the year ended 30 September 2016. Victoria recorded the highest growth rate of all states and territories at 2.1%. The Northern Territory recorded the lowest growth rate at 0.3%.

Australia's Population

The estimated resident population for each state and territory at 31 March 2023 was as follows:

Australia National Total;  26,473,100
New South Wales 8,294,000;
Victoria 6,766,600;
Queensland 5,418,000;
South Australia 1,844,600;
Western Australia 2,855,600;
Tasmania 572,700;
Northern Territory 251,700; and
Australian Capital Territory 464,600. 

Australia’s Ageing Population

Australia’s population, like that of most developed countries, is ageing as a result of sustained low fertility and increasing life expectancy. This is resulting in proportionally fewer children (under 15 years of age) in the population. The median age (the age at which half the population is older and half is younger) of the Australian population has increased over the last two decades, from 32.1 years in 1990, to 38.5 years in 2022. Between 30 June 2009 and 2010 the median age remained relatively steady at 36.8 years. Over the next several decades, population ageing is projected to have significant implications for Australia, including for health, labour force participation, housing and demand for skilled labour.

The ageing of Australia’s population, already evident in the current age structure, is expected to continue. The median age of Australia’s population is projected to increase to between 38.7 years and 40.7 years in 2026 and to between 41.9 years and 45.2 years in 2056 .

At the last census, The median age for capital cities (37.2 years) was younger than the rest of Australia (42.0). Adelaide was the oldest capital city with a median age of 39.4 years, ahead of Hobart at 38.8. 

South Australia also had the oldest population of all the states and territories with a median age of 46.8 years. The second oldest was Tasmania with a median age of 44.7 years, followed by Victoria (43.2 years), New South Wales (42.5 years), Queensland (40.8 years), Western Australia (40.3) the Australian Capital Territory (38.5 years) and the Northern Territory (32.1 years).

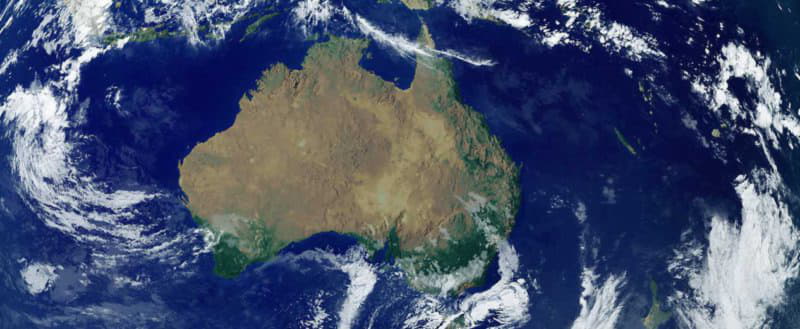
Most of Australia’s population is concentrated in two widely separated coastal regions. By far the larger of these, in terms of area and population, lies in the south-east and east. The smaller of the two regions is in the south-west of the continent. In both coastal regions the population is concentrated in urban centres, particularly the state and territory capital cities.

Australia’s Population density

  • People living in the capitals increased by 2.5 million (17%) between 2011 and 2021.
  • Melbourne had the largest increase (806,800), Darwin grew the least (19,700).
  • Canberra had the highest growth rate (23%), Adelaide had the lowest (11%).
  • Regional Australia grew by 832,000 (11%).

Population density varies greatly across Australia. Australia’s total population density at June 2021 was 3.3 people per square kilometre. Among the states and territories, the Australian Capital Territory had the highest population density at 192 people per square kilometre and the Northern Territory had the lowest population density at just 0.18 people per square kilometre.

At 30 June 2022, population density was highest in the capital cities of Australia’s states and territories.
With the exception of Canberra, all these capital cities are located on the coast. 

Population density in other coastal and surrounding areas was also relatively high, particularly in the southeast corner of the country. On the other hand, most of central and western Australia had a population density of less than one person/km2.

Five of the top ten most densely-populated statistical local areas (SLAs) were located in Sydney, which is currently the most populous city in Australia. At 30 June 2022, the Sydney statistical division had a population of 5.3 million people.

Australia’s Sex Ratio

Darwin was the only capital with more males than females with a sex ratio of 105.8 males per 100 females. At June 2022, the estimated national sex ratio in Australia is 99 males per 100 females. The sex ratio of the states and territories at June 2022 varied from 95.8 in Tasmania, up to 105.8 in the Northern Territory. 


Australia’s Indigenous population

Over recent decades, changing social attitudes, political developments, improved statistical coverage and a broader definition of Aboriginal or Torres Strait Islander origin have all contributed to the increased likelihood of people identifying as being of Aboriginal or Torres Strait Islander origin. The Aboriginal and Torres Strait Islander population of Australia was estimated to be 517,000 people at 30 June 2006, or 2.5% of the total Australian population. In 2006, around 90% of Aboriginal or Torres Strait Islander peoples identified as being of Aboriginal origin, 6% identified as being of Torres Strait Islander origin and 4% identified as being of both Aboriginal and Torres Strait Islander origin. The Aboriginal and Torres Strait Islander population is relatively young, with a median age of 21 years compared to 37 years for the non-Indigenous population in 2006. In 2006, around one-third (32%) of the Aboriginal and Torres Strait Islander population lived in major cities of Australia, 43% in regional areas and 25% in remote areas. The majority of Aboriginal and Torres Strait Islander peoples live in New South Wales (30% of the Aboriginal and Torres Strait Islander population lived in this state), Queensland (28%) and Western Australia (14%). While 12% of Aboriginal and Torres Strait Islander peoples live in the Northern Territory, they do make up almost a third (30%) of the total Northern Territory population. In all of the other states and territory Aboriginal and Torres Strait Islander peoples make up less than 4% of the total population. The latest ABS projections of Australia’s Aboriginal and Torres Strait Islander population show an increase from 517,000 people in 2006 to between 713,300 and 721,100 people in 2021. The projected average annual growth rate of the Aboriginal and Torres Strait Islander population between 2006 and 2021 is 2.2%, much higher than the same rate for the total Australian population (1.4%) (ABS 2010).

Birthplace

Australia’s population has increased each year since the end of World War II, due to a combination of high post-war fertility and high levels of migration. In 1901, 23% of Australia’s population was overseas-born. In 1947 the proportion of the population born overseas had declined to 10%. The creation of a national government immigration portfolio in 1945 accompanied a gradual increase in the proportion of overseas-born Australians and by 1992 this proportion had increased to 23%. In 2002 the number of overseas-born Australians had passed 4.5 million or at 23% of the total population and in 2007 this increased to 25%. The diversity of countries of birth has increased substantially over the years. Patterns of immigration have also changed. For the last few decades, the Italy, Greece and Netherlands-born populations in Australia have been declining. The major migration flows from these countries occurred immediately after World War II and there has been relatively little migration from these countries more recently.

Migration to Australia

Almost 6 million migrants, born in over 200 countries, live in Australia. People born in the United Kingdom continued to be the largest group of overseas-born residents, accounting for 1.2 million people. The next largest group was born in New Zealand with 544,000 people, followed by China (380,000 people), India (341,000) and Italy (216,000). Over the last decade, the proportion of those born in the UK declined from 5.9% of Australia’s population in 2000 to 5.3% in 2010. In contrast, the proportions increased for people born in New Zealand (from 1.9% to 2.4%), China (from 0.8% to 1.7%) and India (from 0.5% to 1.5%). The majority (76%) of overseas-born residents were of working age, 15–64 years at June 2010. Migrants born in Asia, America and Africa had proportionally larger young (0–14 years) and working age (15–64 years) populations compared to those from Europe.

(Source Data on this page: Australian Bureau of Statistics)